Courtesy of Intermountain Medical Imaging, Boise, Idaho.
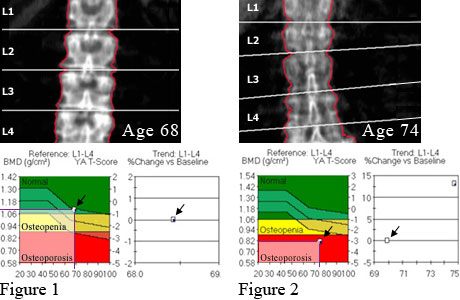
Figure 1 shows a bone density test of a healthy older woman. The X-ray shows a healthy spine. The bone density is determined by the X-ray. The graph shows the bone density number in the green zone (normal).
Figure 2 shows a bone density test of an older woman who has osteoporosis. The X-ray shows weaker bones. The graph shows the bone density number in the red zone (osteoporosis), placing this woman at much greater risk for broken bones (fractures).
Current as of: September 25, 2023
Author: Healthwise Staff
Clinical Review Board
All Healthwise education is reviewed by a team that includes physicians, nurses, advanced practitioners, registered dieticians, and other healthcare professionals.